
9 Dec
2013
9 Dec
'13
5:28 p.m.
Hello,
For a workshop with students I've had to "compile" samples from many
movies, from DVD.
This time I chose my settings for each source file - that's fine.
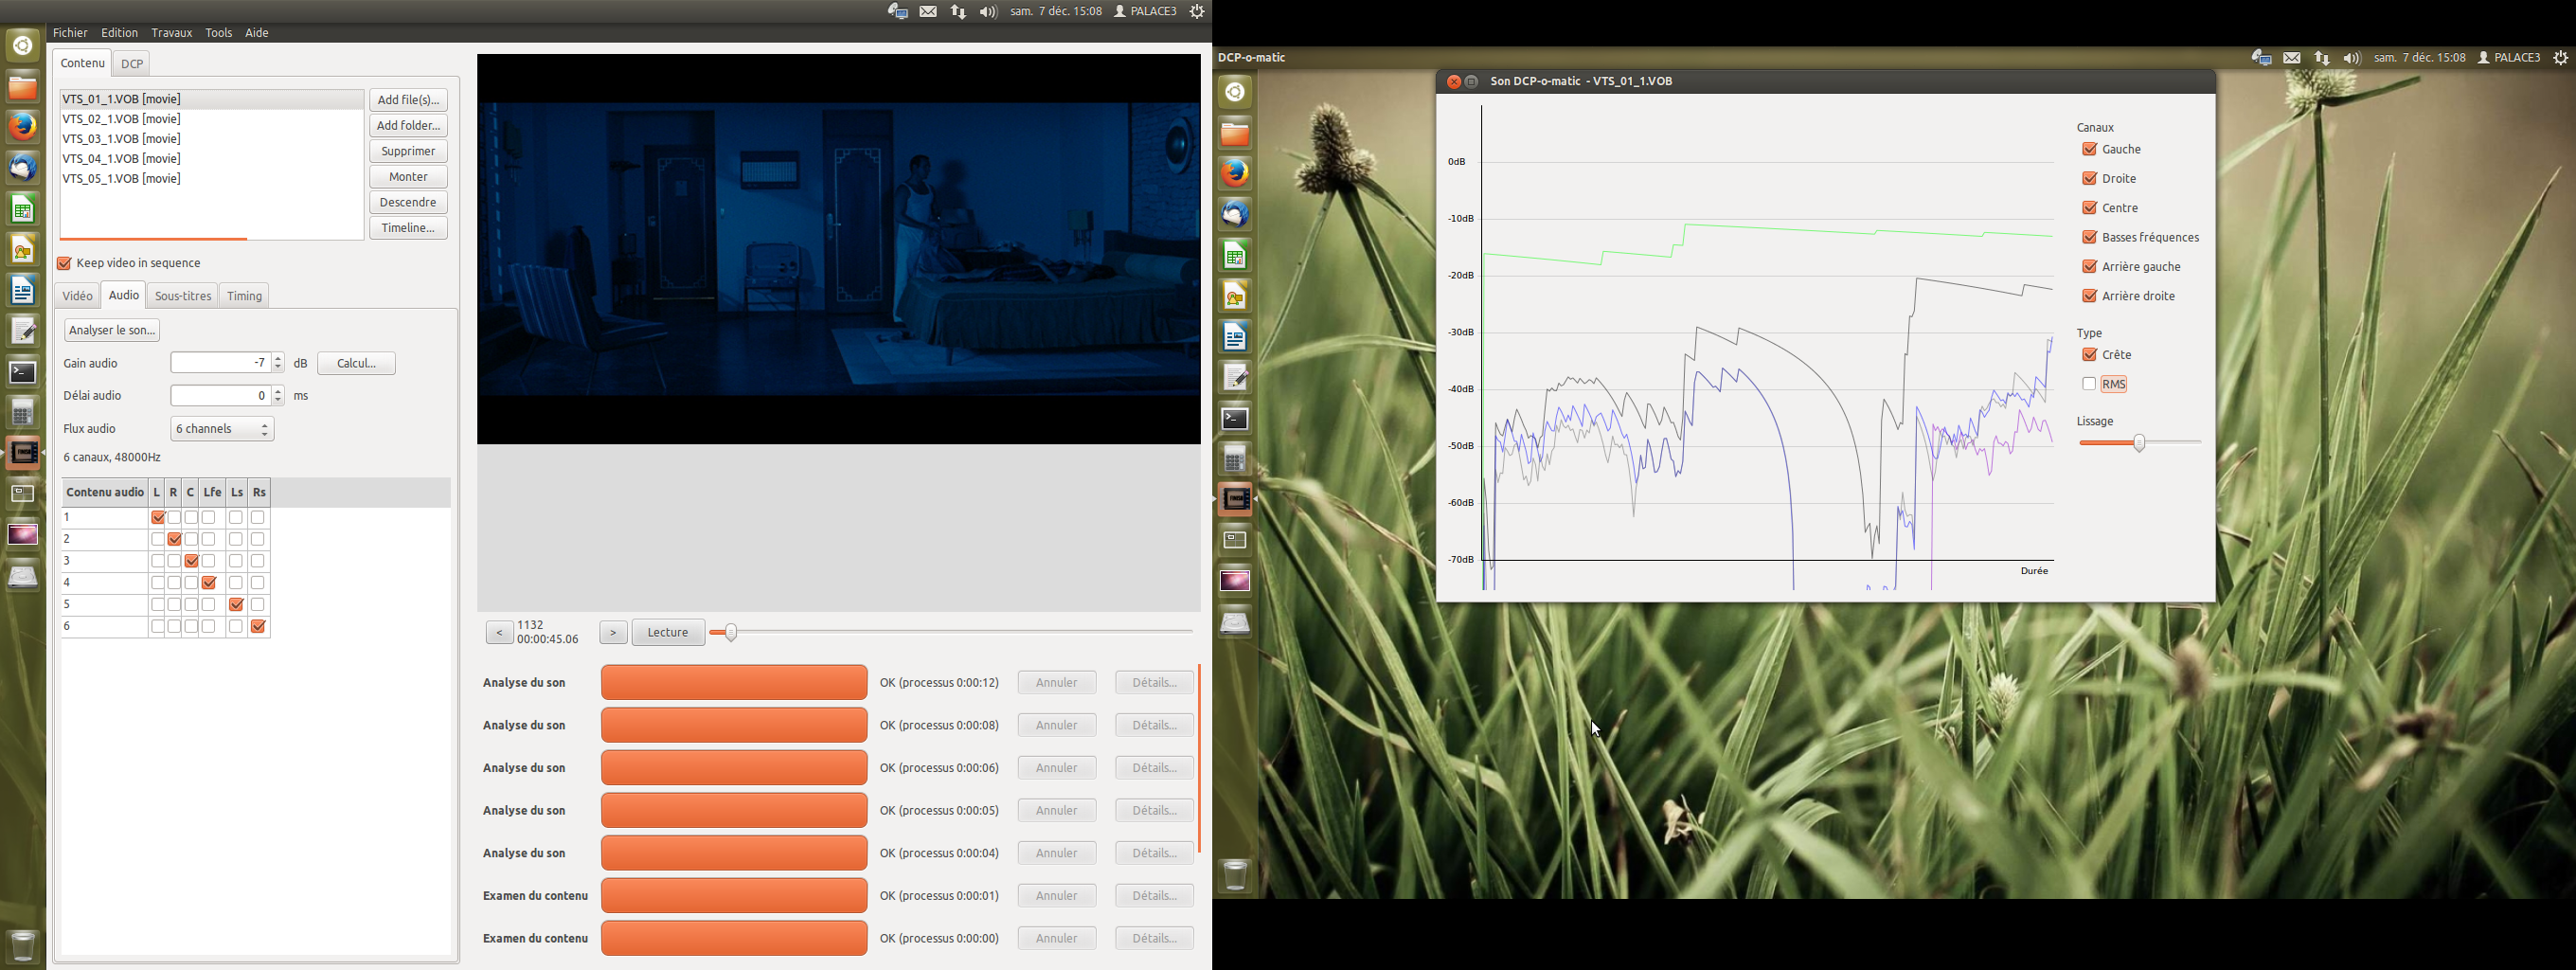
But the "graphs" for sound analysis look rather not logical.
Pictures attached.
One is for VOB 1 and you can see the graph starts at 0, on left.
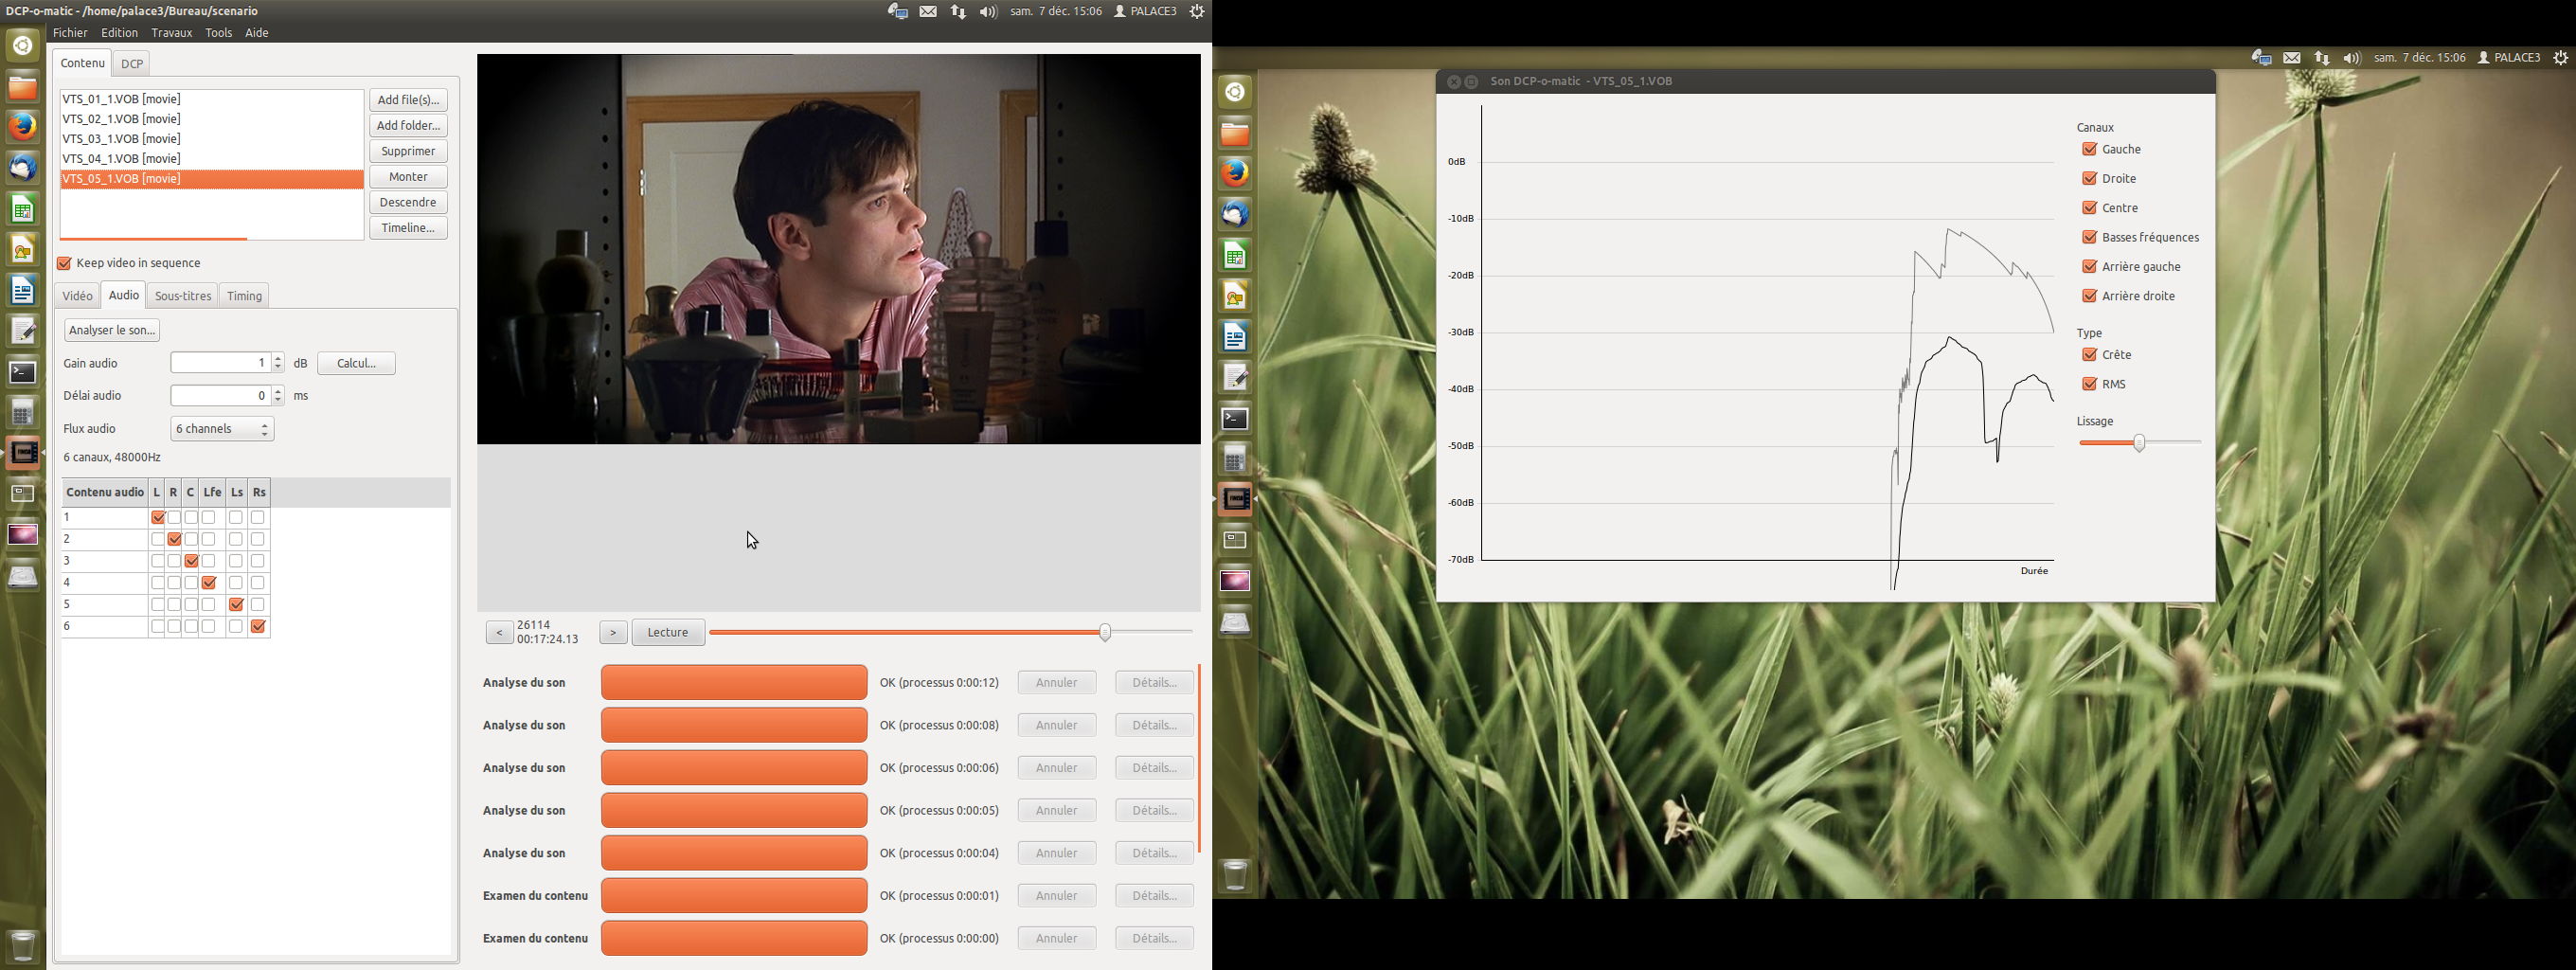
But for all the others VOB, the graph starts at almost the end right of
the table.
(I'm really sorry for my lack of vocabulary, hence the pictures)
Thanx for your attention !
Gérald